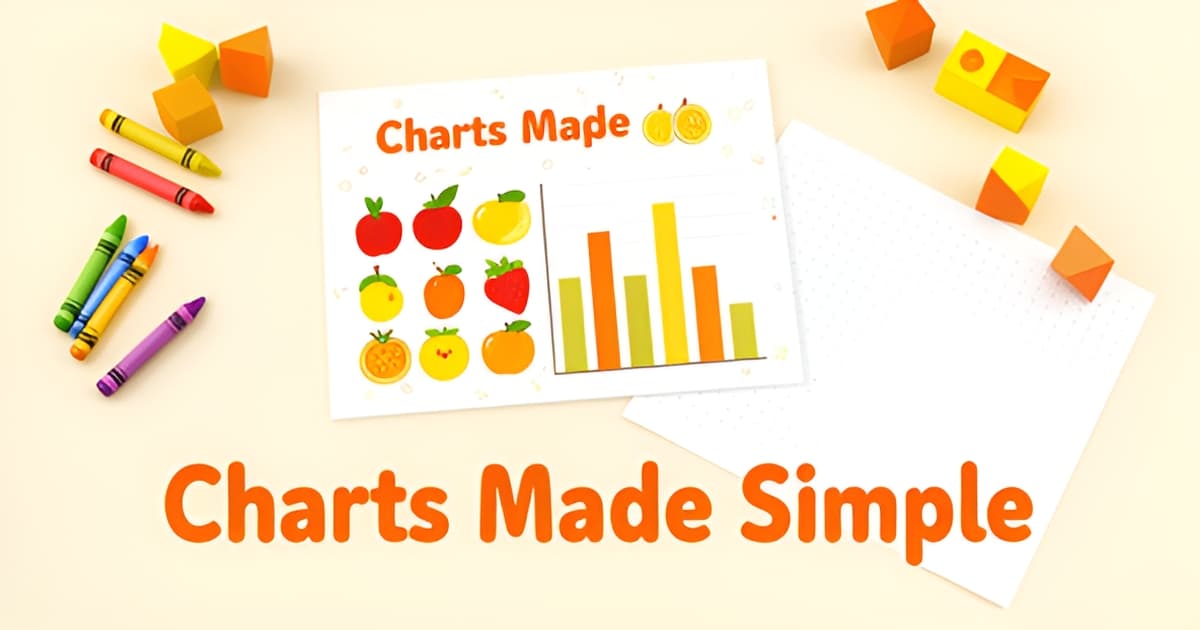
What is a chart for kids?
Key Facts
- Kids worldwide first meet charts in kindergarten, moving from counting objects to bar charts by second or third grade, research across US, French, and Turkish textbooks found.
- Learning with visualizations boosts math achievement with a medium effect (g = 0.504) across 41 studies of 10,562 students.
- Paper-based charts work just as well as digital tools for math learning, according to the same meta-analysis.
- Researchers analyzed 1,500 textbook pages and found roughly 2,600 visuals, yet no curriculum explicitly teaches kids to read them.
- Lead researcher Fanny Chevalier of INRIA calls chart literacy a civic issue, warning that misleading charts can dupe voters and consumers.
- Experts recommend the "I do, we do, you do" method with explicit labels for axes, scale, and categories, per Colorín Colorado's strategy guide.
- Anchor charts work best when kids help decide what goes on them, giving students buy-in and connection to the learning goal.
Why Charts Confuse Kids (Even Bright Ones)
Your child flips open a math textbook and sees a bar chart on nearly every other page. But ask them to read one, and they often can't. That gap has less to do with ability than with how charts are actually taught, which in most classrooms is barely at all.
When researchers set out to understand why, they examined 1,500 pages of textbooks from the US, France, and Turkey and counted roughly 2,600 visuals. The finding that stands out: charts appear constantly, but no curriculum assumes responsibility for teaching kids how to read them. Charts show up inside unrelated lessons, and teachers move on trusting that prior exposure did the job.
For some kids, it does. Many children pick up charts the way they pick up any pattern, through repetition. But others quietly get lost, and the problem compounds. Fanny Chevalier, the researcher who led the textbook analysis, worries that weak chart literacy leaves adults vulnerable to misleading visuals later in life, whether from advertisers, media, or politicians. She frames it as a civic issue, not just a school one.
So what is a chart for kids, really? It's a skill that develops in stages, and the stages matter. Across all three countries studied, children follow the same path:
- Counting real objects, the earliest step, starting in kindergarten
- Free-form pictographs, where kids group similar objects together
- Structured pictographs, with objects stacked to make comparison visible
- Bar charts, where objects get replaced by abstract bars, usually around second or third grade
When instruction skips these steps, bright kids stumble. The researchers found that children who had never seen a bar chart before genuinely struggled until someone made explicit what each part of the chart represented. The fix wasn't more exposure. It was explanation.
There's good news for parents who want to fill this gap at home. A meta-analysis of 41 studies covering more than 10,000 students found that learning with visualizations has a medium, meaningful effect on math achievement (an effect size of 0.504). Just as useful: paper-based visuals worked just as well as digital ones. That means a printable chart activity on the kitchen table isn't a consolation prize for lacking an app. It's an equally effective way to learn.
This is where we designed Printoodle's chart activities around that concrete-to-abstract sequence, with clear labels for axes, scale, and categories so nothing gets assumed. It pairs well with other visual-reasoning practice like mazes for kids, a kids sudoku printable, or rebus puzzles for kids, all of which train kids to read structured visual information before a textbook ever asks them to.
The confusion isn't a flaw in your child. It's a gap in the curriculum, and it's one you can close at home.
What a Chart for Kids Actually Looks Like at Each Age
When people ask "what is a chart for kids," the honest answer depends on the child's age. A chart for a five-year-old looks nothing like one for an eight-year-old, and that difference matters more than most parents realize.
Children move through a predictable sequence when they learn to read charts. First comes counting real objects: buttons, blocks, snacks. Next, kids group like objects together in free-form pictographs, then stack those pictures to make comparisons. Finally, usually around second or third grade, the pictures get replaced by bars. Researchers who analyzed 1,500 pages of textbooks from the US, France, and Turkey found roughly 2,600 visuals and documented this same progression across all three countries, with children encountering charts starting in kindergarten.
Here's the problem: textbooks assume kids picked up chart-reading along the way. They don't teach it directly. Lead researcher Fanny Chevalier of INRIA found that some children simply get lost without explicit instruction, and her team piloted an app with kindergarten and second-grade students who had never seen a bar chart before.
So what does a well-built chart for kids actually include? The experts at Colorín Colorado recommend starting with basic examples and labeling every part explicitly:
- Categories: what each column or row represents, in words a child can read
- Scale: what the numbers on the axis mean and how far apart they sit
- Headers: clear titles for rows and columns so the chart explains itself
- A simple definition of what the pictures or bars stand for
Their broader advice applies at home too: teach one chart type at a time, model how to read it ("I do, we do, you do"), and check comprehension often rather than assuming exposure did the work.
The payoff for this explicit approach is real. A meta-analysis of 41 intervention studies covering 10,562 students found that learning with external visualizations has a medium effect (g = 0.504) on mathematics learning, consistent across topics and age groups. Notably, paper-based charts worked just as well as digital ones, which is good news for anyone printing activities at the kitchen table.
That's the philosophy behind how we build chart pages at Printoodle: start with pictographs kids can count, label the categories and scale clearly, and save bar charts for when a child is ready. The same scaffolding logic shows up across our other logic-builders, from mazes for kids to a kids sudoku printable and rebus puzzles for kids, each matched to what a child can actually do at that age.
Chart literacy starts small: one labeled column of stickers at a time.
The Research Case for Printable Charts
If you've ever felt a little guilty handing your child a printed chart instead of firing up an app, you can stop. The research says your instinct to print is exactly right.
A meta-analysis of 41 intervention studies covering 10,562 students found that learning with external visualizations has a medium overall effect on mathematics learning (g = 0.504, 95% CI [0.379, 0.630]). That effect held across age groups and mathematical topics, which means charts aren't just decoration. They genuinely move the needle on how kids understand numbers.
Here's the finding that should put your mind at ease: the same analysis found that technology was not superior to paper-based visualization. Digital and analog formats performed equally well. The screen doesn't add magic. A well-designed printed chart works just as hard as any app, and it works without a battery, a login, or a distracting home screen full of other temptations.
That matters because chart education in most classrooms is, frankly, disjointed. When researchers examined 1,500 pages of textbooks from the US, France, and Turkey, they found roughly 2,600 visuals, yet charts are rarely taught directly. They show up inside lessons with the assumption that kids already understand them, and some children get lost without explicit instruction. A printed chart you sit down and talk through together fills that gap.
So what does good practice look like when you're using a chart at home or in the classroom?
- Teach one chart type at a time, starting with simple examples that explain what the numbers or pictures represent.
- Label the parts explicitly: axes, scale, categories, headers, rows, and columns.
- Follow the natural progression from concrete to abstract: counting real objects, then pictographs, then bar charts (typically around second or third grade).
- Use a "I do, we do, you do" approach with frequent comprehension checks.
This is why Printoodle builds its chart activities as printable, customizable pages rather than interactive screens. The format matches what the evidence supports, and personalization adds what teachers know from experience: charts that cater specifically to your child and their learning goals create buy-in and connection to the objective. The same logic applies across our puzzle-style printables, from mazes for kids to a kids sudoku printable or rebus puzzles for kids: paper, done thoughtfully, is a legitimate learning medium, not a compromise.
Print it. Doodle it. Done.
How to Teach Charts at Home or in Class: A Step-by-Step Approach
Knowing what a chart for kids looks like is one thing. Teaching a child to actually read and build one is where the real learning happens, and the good news is that a simple, structured approach works.
Start with the "I do, we do, you do" method. Colorín Colorado's strategy guide recommends modeling the chart yourself first, building it together next, then letting the child work independently, with frequent comprehension checks along the way. Keep the numbers small while you model: three apples versus five apples is far easier to grasp than a dataset of twenty items.
Introduce one chart type at a time, and follow the natural developmental sequence. Research across US, French, and Turkish textbooks shows children move from counting real objects, to free-form pictographs, to structured pictographs, and finally to bar charts around second or third grade. Jumping straight to bar charts skips steps some kids need.
Make creation collaborative. Anchor chart guidance from Teach Starter emphasizes that when kids help decide what goes on the chart, they get buy-in and connect to the learning goal. Ask what they want to count: their stuffed animals, favorite fruits, the cars in the driveway.
A few practical rules of thumb:
- Label every part explicitly: axes, categories, and what each picture or bar represents.
- Use small numbers while modeling, then scale up once the concept clicks.
- Check understanding often with quick questions like "Which column has more, and how do you know?"
- Stick with paper. A meta-analysis of 41 studies found analog charts are just as effective as digital ones for math learning.
That last point matters more than you might think. The same meta-analysis of 10,562 students found visualization has a medium effect (g = 0.504) on math achievement, and printable formats deliver it just as well as apps.
Personalization is where Printoodle fits in. Its generator builds chart worksheets from a child's own interests, so the data being counted is dinosaurs or puppies rather than generic shapes. That interest-driven hook gives kids a reason to care about the numbers before the chart even exists.
Charts also pair naturally with other printable math thinking activities. After a charting session, try mazes for kids for spatial reasoning, a kids sudoku printable for logic, or rebus puzzles for kids to stretch symbol interpretation. Each one builds the same skill charts rely on: reading a visual system and extracting meaning from it.
Print it, count it, chart it. Done.
Build Your First Chart Activity in Minutes
Now that you know what a chart for kids looks like, the fastest way to make it stick is to build one together. And you don't need design skills or a curriculum binder. You need a question kids actually care about, and a page to record the answers.
Here's why paper works so well here. A meta-analysis of 41 studies covering 10,562 students found that learning with visualizations has a medium effect (g = 0.504) on math outcomes, and, importantly, paper-based charts were just as effective as digital ones. So a printed worksheet isn't a compromise. It's a fully supported format, especially for classrooms without tablets to spare.
Pick a question with a real, countable answer. Two favorites that work at almost any age:
- Favorite fruits: survey the family or the class ("apple, banana, strawberry, or grapes?"), then color one square per vote.
- Classroom birthdays: chart how many birthdays fall in each month and find the busiest one.
- Shoe sizes, pets at home, or how everyone gets to school. Any question works if the data comes from real kids.
This follows the developmental sequence researchers have observed across US, French, and Turkish curricula: children move from counting real objects to pictographs to bar charts, typically around second or third grade, as documented in research on early chart exposure. Starting with fruit votes keeps things concrete. Each colored square is literally one vote.
With Printoodle, the worksheet side takes minutes. Describe your chart in a short brief, spend a credit, and download a print-ready PDF in Letter size (or A4 with one toggle). Label the axes and categories clearly, since literacy experts recommend explicitly teaching what each part of a chart represents rather than assuming kids already know. Everything you generate lives in your library, and reprints are free forever, so next month's birthday chart costs you nothing.
One tip that makes the activity land: model it first. Draw one column yourself, do the next together, then hand over the markers. That "I do, we do, you do" rhythm keeps kids from getting lost mid-chart.
Once charting clicks, you can extend the same data habit with other printable brain-builders like mazes for kids, a kids sudoku printable, or rebus puzzles for kids for pattern and logic practice. All of them reward the same skill: looking carefully, one step at a time.
Print it. Doodle it. Done.
Frequently Asked Questions
What exactly is a chart for kids, and why are they so confusing even for bright children?
At what age should kids start learning to read charts, and what does the progression look like?
Do printed charts actually help kids learn math, or is screen-based better?
What parts of a chart should I explicitly teach my child so they don't get lost?
My child is already past second grade and still struggles with bar charts, what can I do at home?
How can I make chart practice engaging without relying on apps or technology?
From Kitchen Table to Chart Reader: Where to Go From Here
So, what is a chart for kids? It's a skill built in stages: counting real objects, then pictographs, then bar charts around second or third grade. The research is clear that most classrooms skip the explicit teaching, assuming exposure does the work, and that bright kids quietly get lost when it doesn't. The fix isn't more screen time or more exposure. It's explanation, and paper works every bit as well as digital. A meta-analysis of 41 studies covering 10,562 students found visualizations deliver a meaningful boost to math learning, with analog formats performing just as well as apps. Your next step is simple: pick a question your child actually cares about, print a labeled chart, and model one column yourself before handing over the markers. Printoodle can generate a personalized, print-ready chart worksheet in seconds, and reprints are free forever. Once charting clicks, extend the habit with mazes for kids, a kids sudoku printable, or rebus puzzles for kids. Print it. Doodle it. Done.