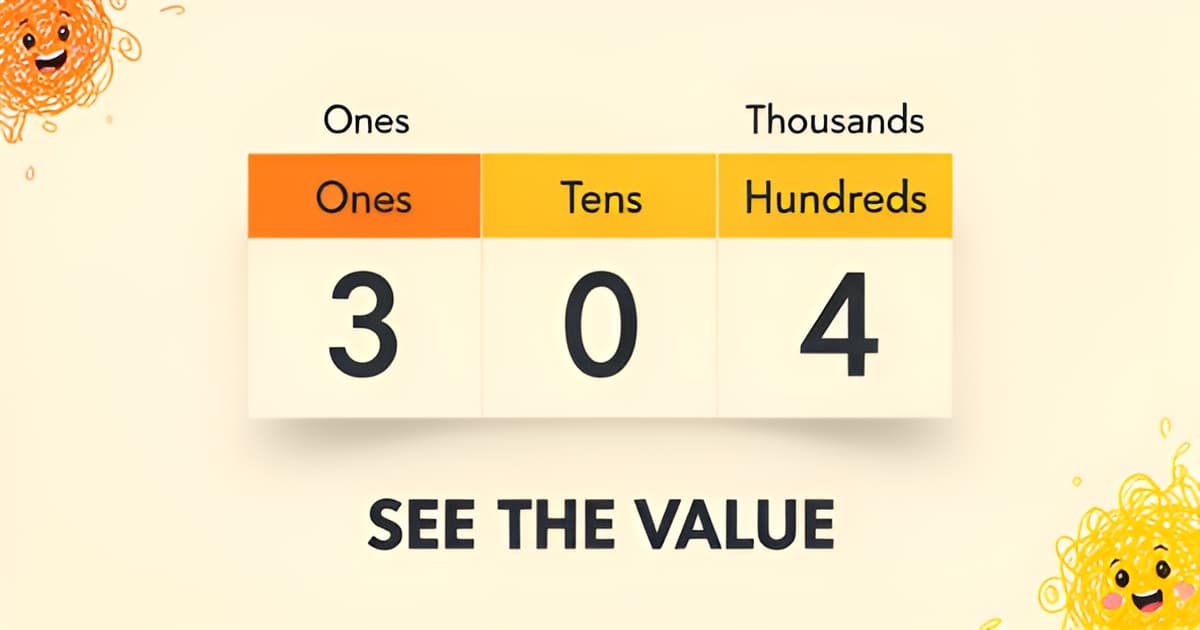
What is the purpose of a place value chart?
Key Facts
- Only 40% of fourth graders correctly identified a four-digit number modeled with Base Ten Blocks on the NAEP 2017 assessment.
- The same digit 5 is worth 50 in 350 but 5,000 in 5,006, showing position determines value.
- Kids who read 304 as 34 aren't guessing, they're lining up digits by count instead of position, a common place value mistake.
- A peer-reviewed case study found teachers must explicitly link concrete materials to number system structure for deep place value understanding.
- 44% of fourth graders chose a distractor answer over the correct four-digit number in the NAEP 2017 data.
- Charts track zero placeholders so students don't misread 4,005 as simply 45, per Mathnasium's guide.
- Place value charts grow with the child from counting to 100 in kindergarten to decimals to thousandths in fifth grade.
Why Kids Misread Numbers (and Why It Matters)
Most kids who mix up 304 and 34 or write 51 for "fifteen" aren't guessing, they're applying a logical but incomplete rule: they’re reading digits in order, not by position. This is exactly why the place value chart exists: it forces students to line up digits by position rather than by count, making it instantly clear that a digit's value is determined by where it sits.
The stakes are high. Data from the NAEP 2017 assessment shows only 40% of fourth graders could correctly identify a four-digit number from base ten blocks, while 44% chose a distracter answer. Place value is the foundation for regrouping and multi-digit operations; without it, later math loses meaning.
A place value chart solves this by organizing digits into labeled columns. As Mathnasium explains, the same digit has different values depending on position: 5 in 350 represents 50, while 5 in 5,006 represents 5,000. The chart also tracks zero placeholders, preventing students from reading 4,005 as simply 45. When 23 and 32 are placed side-by-side on a chart, the visual structure makes it obvious they are not the same number, one has two tens and three ones, the other has three tens and two ones.
Beyond reading numbers, the chart supports writing expanded form, comparing numbers left to right, and understanding decimals. Research confirms that pairing these charts with concrete manipulatives like base ten blocks is essential. A peer-reviewed case study from the ERIC database found that explicitly linking concrete materials, learning activities, and the structure of the number system is necessary for deep understanding. Without this foundation, operations like regrouping in addition and subtraction become procedural tricks without conceptual grounding.
The purpose of a place value chart is to make the invisible visible, showing students that position determines value. Printoodle offers a quick way to generate a printable, write-on chart for classroom or home use. Print it. Doodle it. Done.
The Purpose of a Place Value Chart: Position Determines Value
The digit 5 can be worth 50 or 5,000, and nothing about the digit itself tells you which. That single fact is why the place value chart exists: it's a visual grid that organizes the digits of a number into labeled columns based on their position, so students can see exactly what each digit contributes to the whole. As Mathnasium's teaching guide explains, the chart maps out where each digit belongs, from large whole numbers down to decimals, so we can read, compare, and calculate numbers accurately.
At its core, the purpose of a place value chart is to make the invisible visible. A number like 6,842 looks like four separate digits on paper, but the chart shows it as 6,000 + 800 + 40 + 2, with each column carrying a single digit and a fixed value. When students drop digits into those columns, position stops being an abstract rule and becomes something they can point to. Mathnasium tutors put it well: the visual representation does the conceptual work that rules alone can't.
The same digit lands in different columns and takes on completely different values. In 350, the 5 sits in the tens column and is worth 50. In 5,006, that same 5 sits in the thousands column and is worth 5,000. This is the exact example Third Space Learning uses to show why position, not the digit itself, determines value.
A well-designed chart makes several things visible at once:
- Expanded form, so 6,842 visibly breaks into 6,000 + 800 + 40 + 2.
- A left-to-right comparison routine, so students compare numbers by position rather than by counting digits.
- Zero as a placeholder, which prevents the classic error of reading 4,005 as 45.
- Color-coded periods of three (ones, thousands, millions), with a clear border marking the decimal point.
That last point matters more than it looks. Comparing 9 and 12 in a chart, as one Mathnasium breakdown notes, makes it obvious that 12 occupies a tens column while 9 does not. Without the grid, young students often line up digits by count instead of position, which is exactly how misconceptions like reading 304 as 34 take root.
The stakes are real. NAEP 2017 data shows only 40% of fourth graders correctly identified a four-digit number modeled with Base Ten Blocks, and 44% picked a distractor instead, per Brainingcamp's analysis. A printable chart students can write directly on gives struggling learners a concrete anchor, which is why Third Space Learning recommends printable charts as hands-on supports.
That's the thinking behind Printoodle's place value chart generator: you get a labeled, print-ready grid in seconds, ready for students to write on, erase, and fill in again. Print it, doodle it, done.
Pairing the Chart with Hands-On Materials
A chart on paper is only half the tool. The column labels make sense to a child once their hands have built the number first, which is why teachers consistently pair a place value chart with blocks, cubes, and mats rather than using it alone.
A classic first-grade activity shows how this works. The teacher calls out a number like 23, and children place two tens rods and three unit cubes on their chart mats, physically seeing that position determines value. It also sets up rich prompts like "Are 23 and 32 the same?" which pushes students to notice that swapping positions changes everything, according to one first-grade teaching guide.
The research backing this approach is strong. A peer-reviewed ERIC case study on a "base ten game" found that a place value board paired with concrete materials helps students grasp the underlying structure of the number system, but only when teachers explicitly link the materials to that structure. Blocks on a mat don't teach place value by themselves; the connection has to be made visible.
That matters because skipping the concrete stage carries real costs. Mathnasium tutors warn that jumping straight to written notation before students have a concrete foundation is one of the main reasons place value misconceptions form. The NAEP 2017 assessment backs this up: only 40% of fourth graders correctly identified a four-digit number modeled with Base Ten Blocks, and 44% chose a distractor, as Brainingcamp's analysis notes.
The same chart and blocks extend naturally to decimals by redefining what each block represents:
- The flat now equals 1 whole instead of 100
- Rods represent tenths (0.1)
- Unit cubes represent hundredths (0.01) and thousandths (0.001)
Because the chart's structure stays identical, students carry their whole-number understanding straight into decimal territory. As Mark Schmit of Brainingcamp puts it, without this strong foundation, regrouping and operations with multi-digit numbers and decimals lose any meaning.
If you're building these activities yourself, a printable, write-on chart is exactly the kind of hands-on support struggling students need, and tools like Printoodle let you generate one in seconds. Print it, hand over the blocks, and let the columns do the talking.
Using a Printable Place Value Chart at Home or in Class
Understanding what is the purpose of a place value chart is one thing; putting it to work with a real child is another. A printable, write-on chart turns an abstract idea into something a student can touch, mark up, and redo as many times as needed. Teachers of struggling students use printable charts exactly this way, as hands-on manipulatives that students can write directly on while they work through a number.
The payoff is real. In NAEP's 2017 grade 4 assessment, only 40% of fourth graders correctly identified a four-digit number modeled with Base Ten Blocks. That gap between seeing blocks and understanding what they represent is precisely what repeated practice on a chart helps close, especially when the chart is paired with concrete materials like tens rods and unit cubes.
One of the best things about a printable chart is how long it lasts. Because place value scales across the elementary grades in the Common Core progression, the same tool grows with the child:
- Kindergarten: counting to 100 and writing numbers to 20
- First and second grade: two-digit and three-digit numbers, up to 1,000
- Third grade: rounding to the nearest 10 or 100
- Fourth grade: recognizing that a digit is 10 times the place to its right
- Fifth grade: decimals to the thousandths, with the decimal point clearly bordered
Print one chart for a kindergartner counting cubes, and reprint it years later with extra decimal columns. First-grade teachers use the chart as a game board: call out a number like 23, and the child places two tens rods and three unit cubes in the right columns. Then ask the question that trips up so many beginners: "Are 23 and 32 the same?" On the chart, the answer is visible at a glance, because position determines value (Susan Jones Teaching).
Older kids need engagement too. Gamified activities like Place Value Bingo scale from single-digit numbers all the way up to seven-digit numbers approaching 1,000,000 (Teach Starter), and a write-on chart keeps every player's digits lined up correctly.
If you'd rather not draft a chart grid by hand, Printoodle's place value chart generator creates a print-ready version in seconds, and reprints from your library are always free. Print it. Doodle it. Done.
Frequently Asked Questions
What is the purpose of a place value chart?
Why does my child keep mixing up numbers like 304 and 34?
Can the same digit really have different values in different numbers?
Do I need to use the chart with blocks, or is the chart enough?
How well are kids actually doing with place value?
What age should kids start using a place value chart?
Key Takeaways
{ "title": "Why Position Matters: Making Math Visible", "content": "A place value chart does more than organize digits, it transforms abstract numbers into something students can see, compare, and understand. By lining up digits into labeled columns, the chart reveals that a digit's value is dete